Grid
Table of contents
library(spectralGraphTopology)
library(igraph)
library(viridis)
set.seed(0)
# number of nodes
p <- 64
# build grid graph
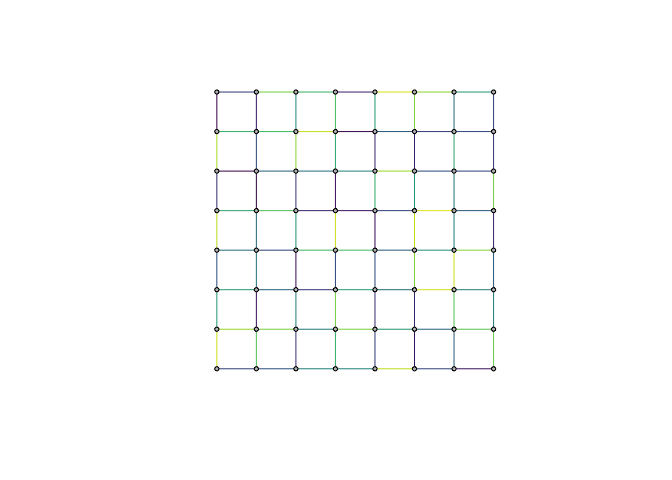
grid <- make_lattice(length = sqrt(p), dim = 2)
# number of observations
n <- as.integer(100 * p)
# assign random weights to edges
E(grid)$weight <- runif(gsize(grid), min = 1e-1, max = 3)
# compute true Laplacian and Adjacency matrices
Ltrue <- as.matrix(laplacian_matrix(grid))
Wtrue <- diag(diag(Ltrue)) - Ltrue
# sample data from grid graph
Y <- MASS::mvrnorm(n, mu = rep(0, p), Sigma = MASS::ginv(Ltrue))
# compute sample covariance matrix
S <- cov(Y)
# learn graph on the basis of the observed data
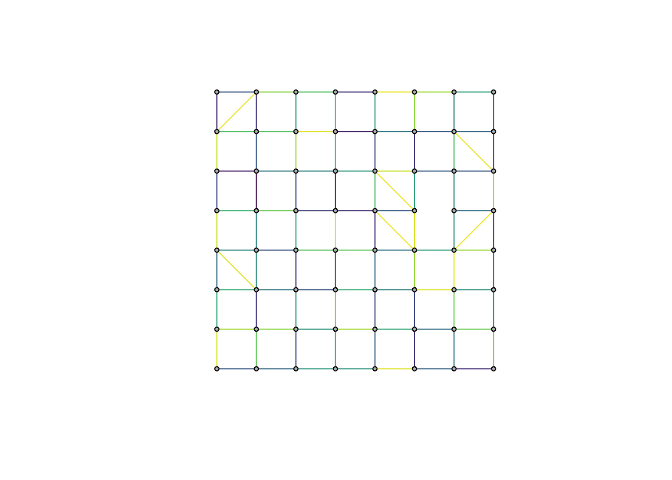
graph <- learn_k_component_graph(S, w0 = "qp", beta = 20, alpha = 5e-3, abstol = 1e-5, verbose = FALSE)
graph$adjacency[graph$adjacency < 5e-2] <- 0
# build estimated graph
estimated_grid <- graph_from_adjacency_matrix(graph$adjacency, mode = "undirected", weighted = TRUE)
# colorify graph
colors <- viridis(20, begin = 0, end = 1, direction = -1)
c_scale <- colorRamp(colors)
E(estimated_grid)$color = apply(c_scale(E(estimated_grid)$weight / max(E(estimated_grid)$weight)), 1,
function(x) rgb(x[1]/255, x[2]/255, x[3]/255))
E(grid)$color = apply(c_scale(E(grid)$weight / max(E(grid)$weight)), 1,
function(x) rgb(x[1]/255, x[2]/255, x[3]/255))
V(estimated_grid)$color = "grey"
V(grid)$color = "grey"
la <- layout_on_grid(grid)
# plot graph
plot(grid, layout = la, vertex.label = NA, vertex.size = 3)
plot(estimated_grid, layout = la, vertex.label = NA, vertex.size = 3)
| True grid graph |
Learned grid graph |
 |
 |